Sacramento Police Dispatch Data App
Posted: August 5, 2019
Introduction
The goal of this project was to create an interactive application allowing users to gain insight into the Sacramento Police Department Dispatch Data available on the City of Sacramento Open Data Portal. While it is fantastic that the city makes the data publicly available, it is very difficult to gain any insight into the data, especially for someone who may not be technically inclined. Thus, hopefully the app can bridge the gap between the data and the user.
The app was created using the Shiny package in R. The map makes use of the Leaflet package. The data is pulled via an ArcGIS REST API using a fork of the esri2sf package.
The code for the project is available on GitHub.
The app is currently live and can be viewed at mvanbommel.shinyapps.io/SacCrimeData
Design
The basic design makes use of the shinydashboard package. The main body of the page is the map showing the locations of the filtered dispatch calls, highlighting spatial element of the data. The map includes both a high level overview of the location distribution (via the heatmap) and detailed information on individual calls (via the markers). The dashboard sidebar is then free to be used for inputs to filter the data displayed on the map, and can be collapsed to provide additional space for the map. In addition to the collapsible sidebar, Shiny uses Bootstrap to present a responsive design, allowing the app to look good on a variety of screen sizes.
Lessons
Open Data Difficulties
Working with the open data set caused several difficulties throughout the process. First, there is little documentation that I could find, leaving me to guess, infer, and Google my way through much of the process. I was not even able to find descriptions of the variables. Further, whenever something changed with the data set (outlined in the next paragraph) there appeared to be no records or notice indicating such.
Next, the data set changed over the course of the development of the app. Previously, there had been several 'time' columns (Received Time, En Route Time, At Scene Time, etc.) outlining the time of progress throughout the police response. However, at some point these columns were removed, and the time information was lost. Thus, while I had been creating a visualization to display and interact with response times, I had to remove it once the information stopped being provided. Additionally, column name and order changes forced me to continually edit the code to keep everything functioning.
Finally, sometimes the API used to access the data stops working. Once I realized this was an artifact of the API itself and not caused by my code, it forced me to add a backup option - a saved data set that could be accessed at times the API stopped functioning.
Customizing Leaflet
Leaflet is an open-source JavaScript library for creating interactive and highly customizable maps. The Leaflet R package does an excellent job at bringing many of the features of Leaflet into the R environment (especially when combined with the leaflet.extras package), but of course it will have its limitations. One such limitation I encountered was using the draw toolbar, without treating the drawings as layers. Treating the drawings as layers is the expected behaviour, however it did not provide the functionality I needed. Thus, since no layers were being created, the delete button in the draw toolbar was always disabled, even when there were drawn shapes that could have been deleted, as shown in the screenshot below.
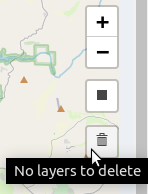
To get around this limitation, I had to hijack the button's functionality using JavaScript.
Specifically, I use the jQuery replaceWith() method to replace
the Leaflet button with my own custom button. The exact
function I used was:
  function changeDeleteButton() {
    // If leaflet delete button is present, replace it with custom button
    if ( $( "a.leaflet-draw-edit-remove" ).length ) {
      $( "a.leaflet-draw-edit-remove" ).replaceWith( "<button class='delete-button' title='Clear Rectangle'> </button>" );
    }
  }
I then used custom CSS to style the button and made use of Shiny's ability to communicate via JavaScript to create a new input value and change its value whenever the button is pressed, using the JavaScript functions:
  $( document ).on("shiny:sessioninitialized", function(event) {
    Shiny.setInputValue("clear_rectangle", "FALSE");
  });

  $(document).on('click tap', '.delete-button', function () {
    // When delete button is clicked, change input$clear_rectangle to TRUE
    Shiny.setInputValue("clear_rectangle", "TRUE");
  });

  Shiny.addCustomMessageHandler('resetInput', function(variableName) {
    // Set input variable to NULL
    Shiny.setInputValue(variableName, null);
  });
Along with the Shiny code:
observeEvent(input$clear_rectangle, {
if (input$clear_rectangle == 'TRUE') {
session$sendCustomMessage(type = "resetInput", message = "clear_rectangle")
}
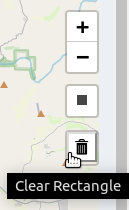
})which invokes the CustomMessageHandler defined above. The result of all this code, is a customized, enabled delete button in the draw toolbar:
Querying the API
All data in the app (with the exception of the backup in case the API is down) is queried from an ArcGIS REST API. Constructing the queries was a learning process and while there is some documentation, much of the process involved trial and error. Since the inputs and filters are interactive, I also had to programmatically construct the queries, based on the user selected values.
A huge help in the querying process was the esri2sf
package. The package takes a query, retrieves
the corresponding JSON from the API, and then converts the result to a data frame. I then
edited the package to allow for limits and offsets to also
be passed to the API. The limit parameter defines how many results (rows) to return, while
the offset parameter defines the number of results (rows)
to skip. Thus a query with a limit of 100 and an offset of 0 will have distinct results from
a query with a limit of 100 and an offset of 100. Since
the API limits the number of results returned to 1000, these additional
parameters add control over exactly which results are
returned. The edited package is available for download on GitHub or can be installed in R using the
command: install_github(repo = "mvanbommel/esri2sf") from the remotes
package.
Conclusion
The app took much longer to develop than I originally anticipated. I began with overly ambitious ideas and plans, and once I decided to simplify the app to its core components, the development process went much more smoothly. I also changed much more than I originally anticipated after soliciting some initial feedback. With a fairly simple app, I figured it would be easy to make intuitive decisions and that any feedback would be minor. However, the value of outside opinions quickly became obvious and I believe the app improved significantly because of them.
Overall, I am quite pleased with the end product. I believe the app is elegant and functional, and greatly improves the accessibility and interactivity of the data presented. If you have not taken a look yet, be sure to go play around with the live app or to download the source code. If you arrive at any interesting insights or conclusions from the data, be sure to share them with me! And also feel free to reach out with any feedback you have to help improve the app even further.